I created this report from an R Notebook as the capstone project to Google’s Data Analytics Certificate course, hosted on Coursera. The purpose of the project was to analyze the data of a bike-share company in Chicago, and provide recommendations to the company’s marketing team for their new ad campaign.
The report is extremely detailed and shows nearly all the steps I took in the analysis process. It begins with uploading and manipulating the data in PostgreSQL and Excel, then moves to cleaning and reorganizing the data, and ends with visualizations created in RStudio and Tableau.
Highlights
- Used SQL to combined datasets and explore data
- Calculated ride times in SQL, and cleaned data of negative ride times
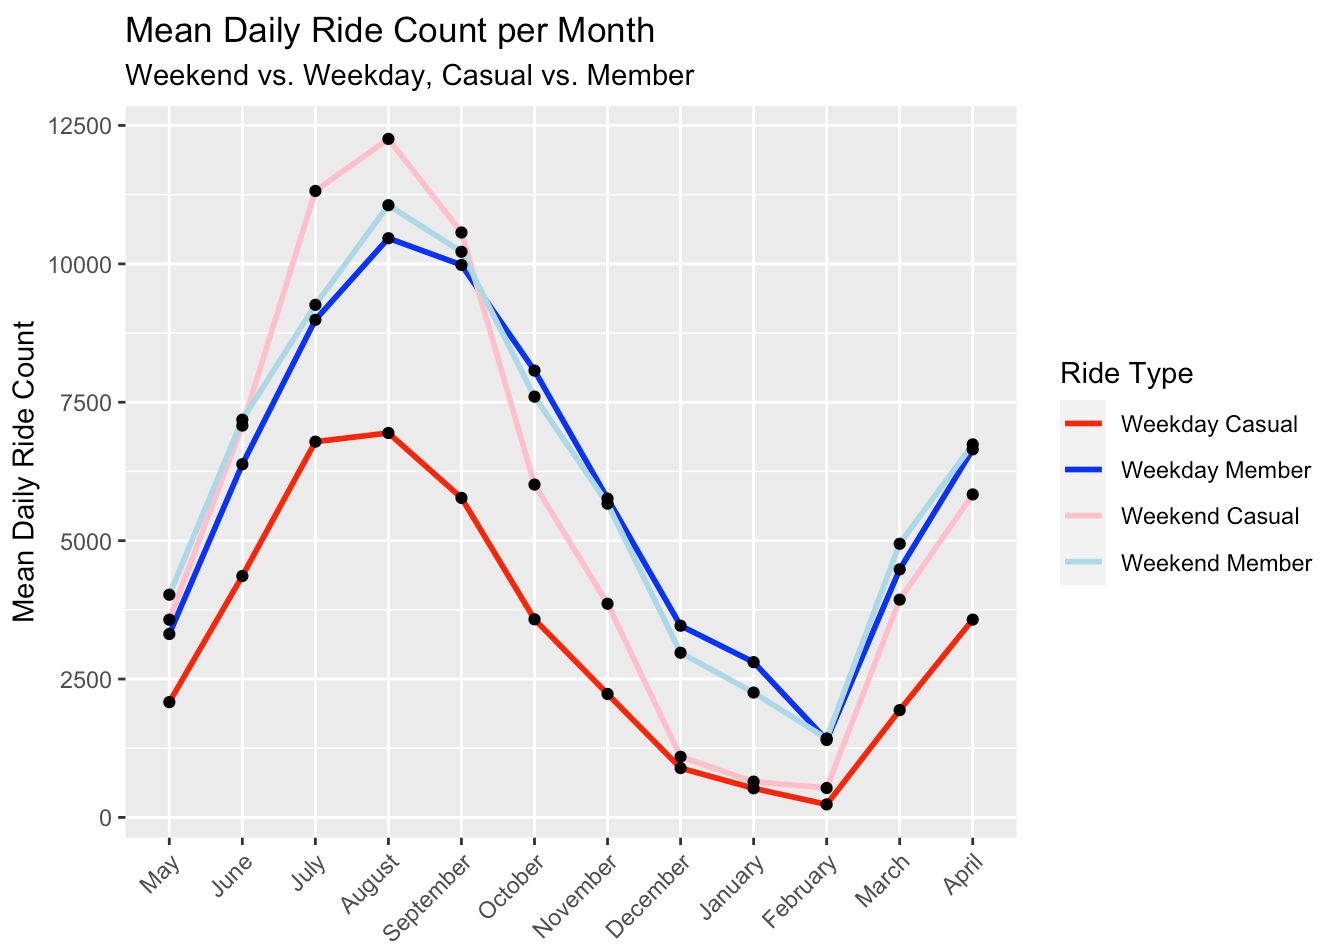
- Using SQL, calculated mean ride times, weekend and weekday ride counts, mean weekend and weekday ride counts by month
- Used R and Lubridate library to converted ride times (HH:MM:SS) to decimals
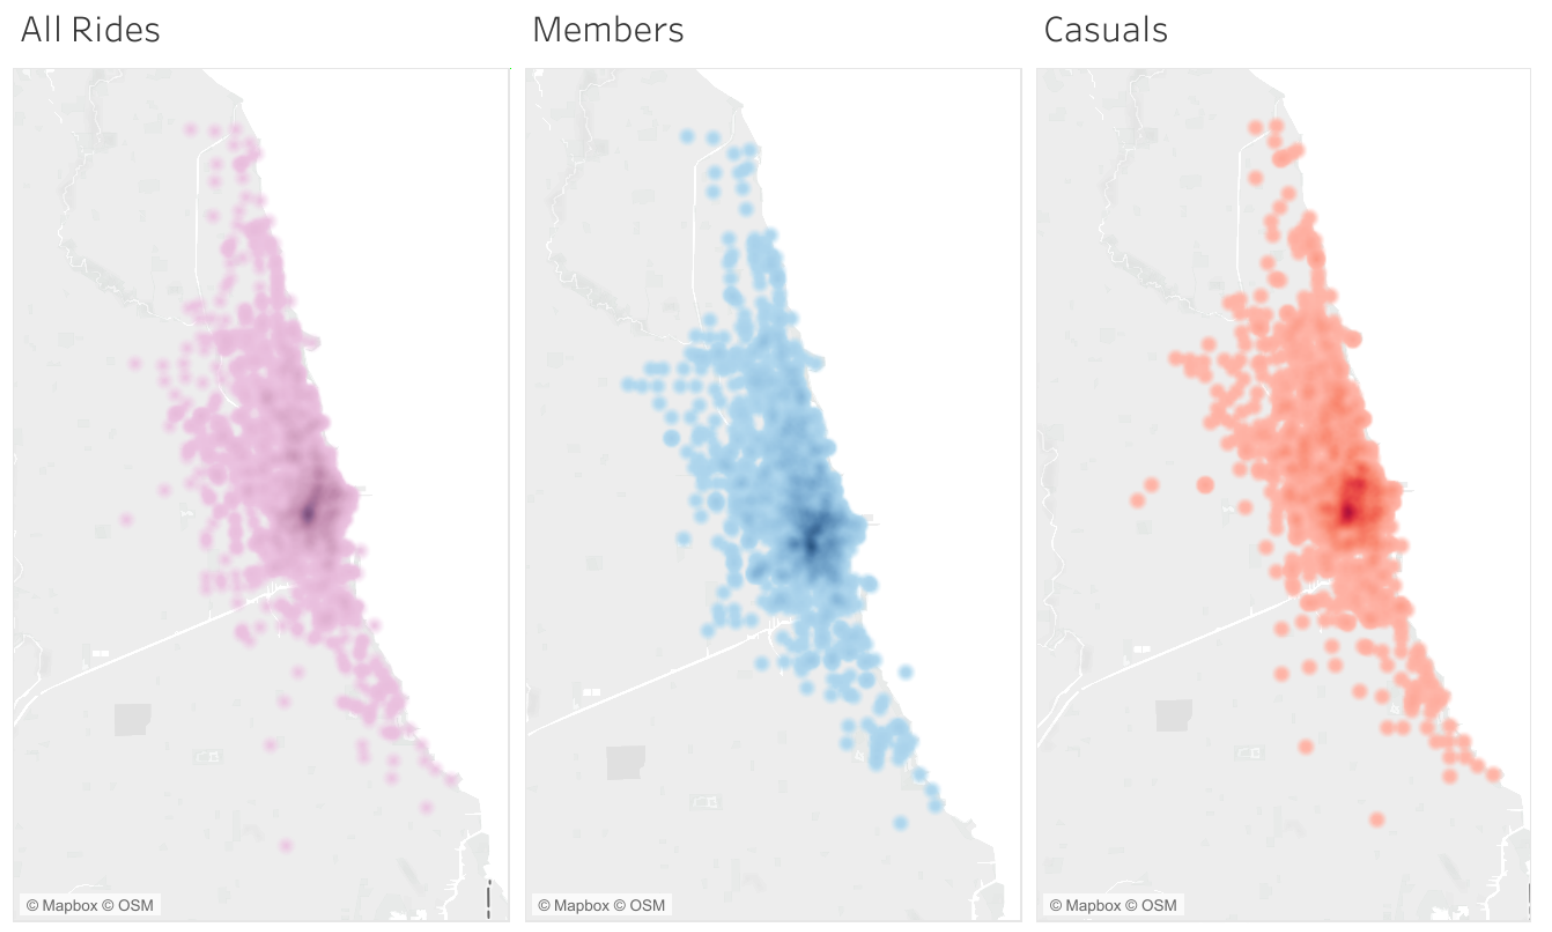
- Used SQL to clean the latitude and longitude data
- Plotted mean ride times, weekend/weekday ride counts, mean weekend/weekday ride counts using ggplot2 library
- Created map visualizations in Tableau
Applications used
- PostgreSQL
- Postico
- Excel
- RStudio
- Tableau
Languages used
- SQL
- R
Preview