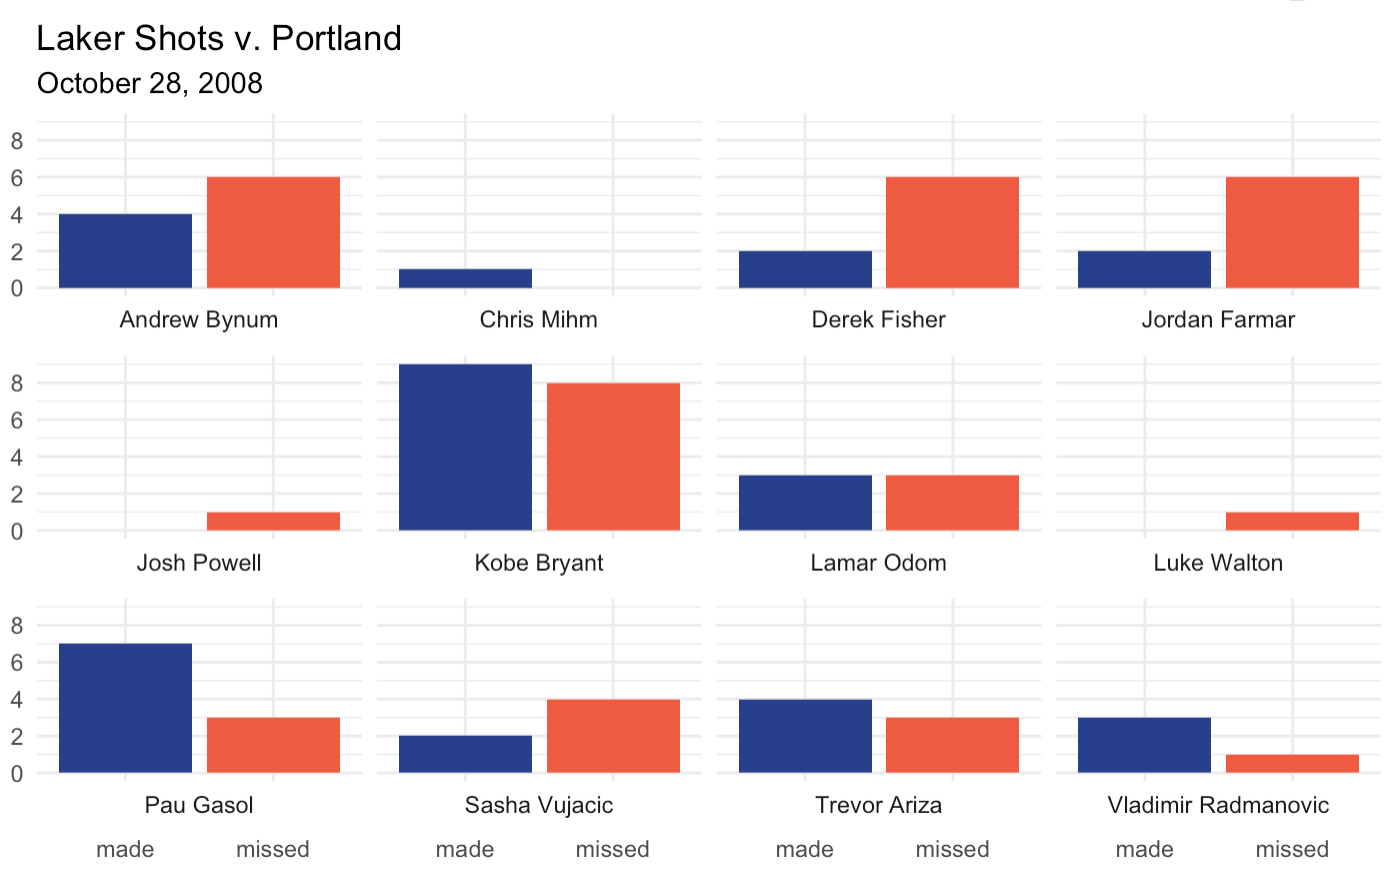
A fun project using the built-in Lakers data from the Lubridate package. I practiced filtering and plotting with ggplot2 to analyze each Laker’s performance in the first game of the season, against the Portland Trailblazers. The notebook goes through every step of my thinking process, so if it seems tedious and wordy, that’s why.
Highlights
- Data comes from the Lubridate library in R
- Filtered the data using dplyr library
- Used ggplot2 to create visualization
Applications used
- RStudio
Languages used
- R
Preview