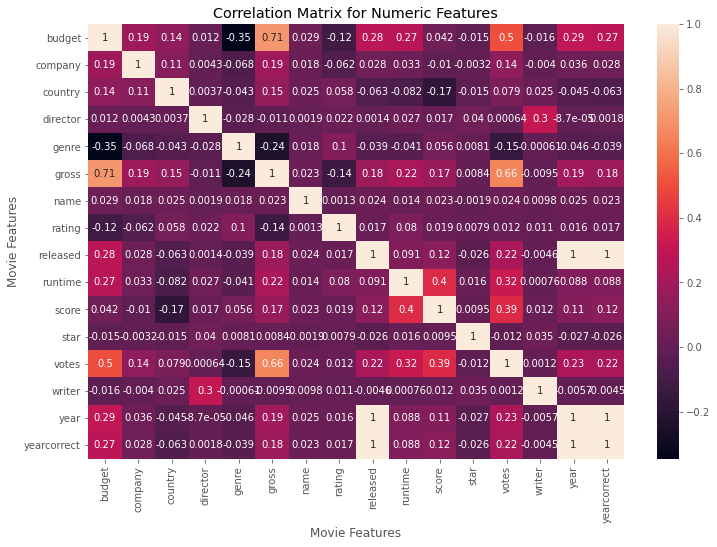
I downloaded the dataset ‘Movie Industry’ from Kaggle.com for this project. I wanted to see if there were any particular features about movies – their budget, or the company that filmed them, or their director, etc. – that correlated with gross earnings. After cleaning the data, I generated heat maps to show relationships between the different features in the dataset. I concluded that the strongest correlations to gross earnings were a movie’s budget and the number of votes it received.
Highlights
- Used pandas to import dataset into a dataframe
- Generated scatterplots using matplotlib
- Looked for missing data using numpy
- Converted object data to category/numerical data for better analysis
- Used seaborn to generate a regression line over a scatterplot
- Used seaborn to generate a heatmap
Applications used
- Jupyter Notebooks
Languages used
- Python
Preview