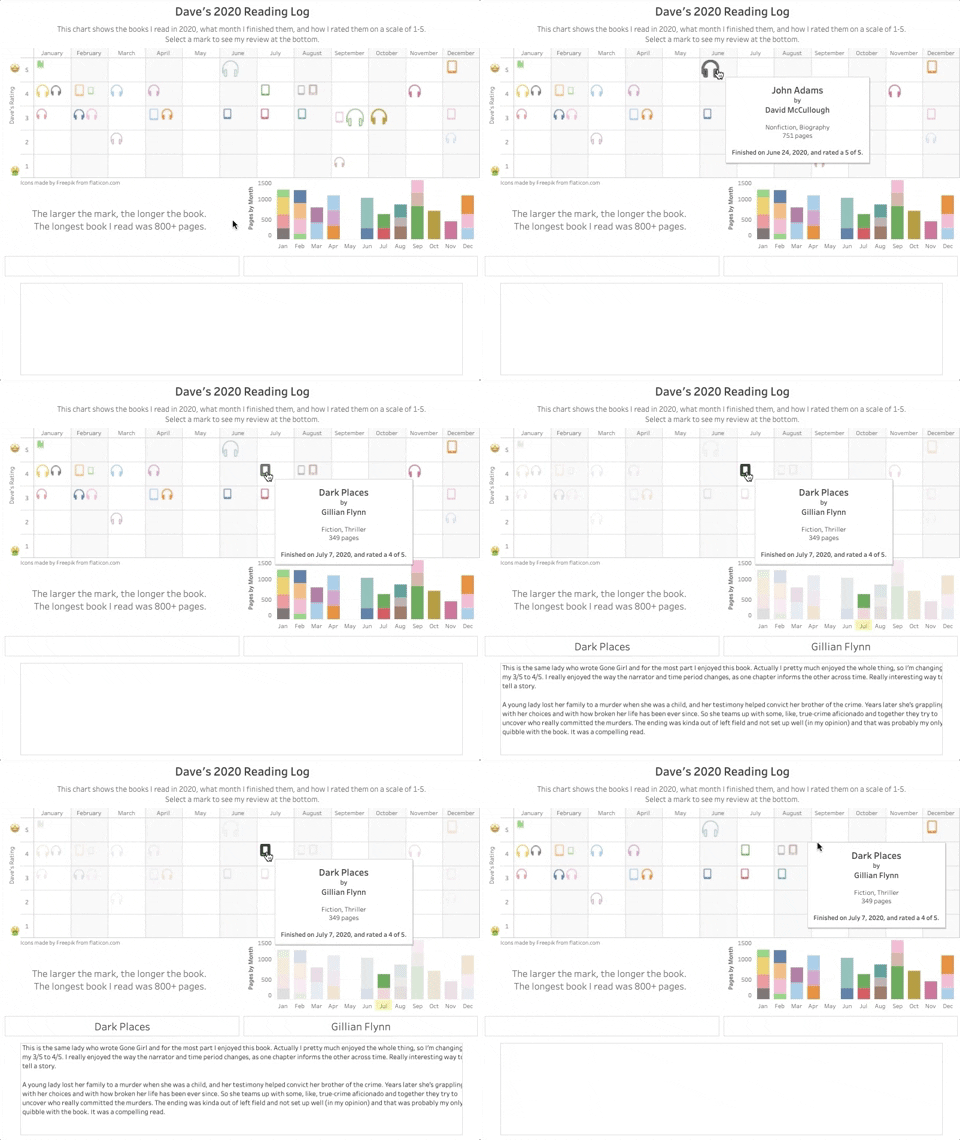
This project is a visualization of all the books I read in 2020. It shows the following points of information: The month I finished reading the book; the rating I gave the book on a scale of 1-5; the page count of the book; and the format through which I read the book.
It is interactive, and allows the user to read my review of each book by selecting an icon on the chart at the top. Selecting an icon will also highlight the book’s page count in the bar graph.
I used a web-scraping program based in R to scrape the GoodReads.com website for page numbers for all of the books.
Highlights
- Stored and organized data in Google Sheets
- Used Tableau to create visualization
- Imported custom shapes into Tableau to show the book format
- Used web-scraping tool in R to gather data
Applications used
- Tableau
- Custom shapes
- Google Sheets
- RStudio
Languages used
- R
Preview

